Interesting what you can do with a Fusion table:
Sunday, October 25, 2015
Saturday, August 29, 2015
Public Transit Should Be Uber’s New Best Friend
Important to note that this is a very NYC specific analysis and the finding related to income and taxi use are counter to what is seen in other cities.
Public Transit Should Be Uber’s New Best Friend
Sunday, August 16, 2015
Tapestry Segmentation

ESRI has a fun web site that provides a good interactive demo of the Tapestry segmentation. Sometimes referred to as a "geodemographic" segmentation system.
Link: Tapestry Zip Lookup
Thursday, July 23, 2015
Review of Simple Online Mapping Tools

Simple Mapping Tools
Wednesday, July 1, 2015
What is the New Google/Esri Relationship?
Good overview by Sean Higgins about the recent announcements from ESRI and Google.
What is the New Google/Esri Relationship?
What is the New Google/Esri Relationship?
Tuesday, June 9, 2015

Thursday, May 21, 2015
How Suburban are Big American Cities?
 Yes, as many of us already know, the Census does not define "Urban" and "Rural", much less "Suburban". This article from the FiveThirtyEight blog attempts to use a survey to get to a working definition. Not their best work, but an interesting approach, none the less. The survey only includes about 2000 respondents, and there are over 30,000 zip codes. so not a very robust sample.
For those of you who want to cut to the chase, here are the rough break points they came up with:
Urban : > 2,213 households per square mile
Rural : < 102 households per square mile
You can read about it here: How Suburban are Big American Cities?
Monday, April 6, 2015
How We Spend Our Money
 FlowingData: How We Spend Our Money, a Breakdown
This interesting, interactive chart shows how our personal spending patterns have changed over the years.
Gay Marriage State by State: A Trickle Became a Torrent
 NY Times: Gay marriage timeline by state
In a few simple charts, The Times showed how quickly gay marriage laws were evolving across the United States.
Wednesday, March 18, 2015
Yield Curve 101

An interesting graphic from The NY Times Upshot section:
A 3-D View of a Chart That Predicts The Economic Future: The Yield Curve
Thursday, February 26, 2015
Google’s recent deprecations ‘not cataclysmic’
A post on Directions Magazine about Google recent decision to deprecate the Earth and Maps APIs from Diana S. Stinton: Google’s recent deprecations ‘not cataclysmic’
Sunday, February 15, 2015
Record Snowfall in Boston

Great visualization on twitter by Sam Lillo of how historic the snowfall has been this year in Boston.
Thursday, February 12, 2015
The "Donut" Hypothesis

The goal was to test the "donut" hypothesis — the idea that a city will create concentric rings of wealth and poverty, with the rich both in the suburbs and in the "revitalized" downtown, and the poor stuck in between. Not sure who to attribute this "hypothesis" to, but my own graduate research (yes, from a very long time ago) was built upon findings that the exact opposite was true. Income doesn't form a geographic "donut", it more resembles a wedge shape, or in keeping with the pastry analogy, a "slice of pie".
Regardless, the maps are interesting, and the site overall is worth perusing.
Wednesday, February 11, 2015

Tuesday, January 27, 2015
Overview of Demographic Retrieval Schemes
A nice overview of demographic retrieval systems from our friends at Trade Area Systems : Trade Area Systems Blog
Sunday, January 25, 2015
Location, Location, Location
Those of us in location research want to believe that old adage, but as this video shows, customer service always wins out. Phil the pharmacist always puts the customer first.
Credit goes to Amy Schumer for making this point clear.
Credit goes to Amy Schumer for making this point clear.
The Secrets of Street Names and Home Values
 Interesting analysis on the value of street names from the NY Times ad Zillow:
The Secrets of Street Names and Home Values
See how your street name compares!
Monday, January 19, 2015
Top Movies of 2014

I saw the movie Birdman recently and was blown away by its originality and technical complexity. The movie would certainly be on my personal "Best of" list, which got me thinking: how many "Best of 2014" lists did that movie make?
Of course, in the boundless internet world we live in, it is impossible to catalog all the "Best of 2014" movie lists, but the FiveThirtyEight did a pretty respectable job of summarizing the major ones. According Hayley Munguia's analysis, Birdman was on 10 of the 30 lists she sampled.
I was also interested in answering an additional question that might help me find other movies I would like, specifically, what other movies were consistently found on the same lists as Birdman. I've also been looking for an excuse to generate one of those cool animated network graphs.
I spent a couple of hours scouring the internet for "Best of 2014" movie lists (hey, it was a rainy Sunday) , starting with those listed in the FiveThirtyEight article footnotes. I added in a few others that I felt were relevant, and skipped a few I simply couldn't find. My final list is comprised of 126 distinct movies (!) across 25 source lists. A link to the various the source lists can be found here: Movie List Sources
Here's the composite top 10

After creating the database, I did a summary count for each time a movie pair was on a list, and created a network graph in Google docs. You can open the full chart from here: 2014 Movie Network Graph
The data is interactive, and clicking on a node will show you all the other movies that were critically linked (min. 3 links, but you can play with that filter). Node size corresponds to the total number of links.
Sunday, January 18, 2015
How to Make a Map (part 2)
Here's a YouTube video explaining how to import a spreadsheet into Google maps.
Importing Spreadsheets into Google Maps
Importing Spreadsheets into Google Maps
Saturday, January 10, 2015
Maps in Tableau
Tableau has some interesting mapping capabilities. Mostly, it's mapping tools are best for "infographic" type maps, however the data-first approach can lead to some interesting visualization. The following links to some interesting Tableau map samples.
Tableau Mapping Month Round-up
Tableau Mapping Month Round-up
Friday, January 2, 2015
How to make a map (part 1)
In my first entry of (what I hope to be) a series, I'm testing out CartoDB, a free cloud based mapping engine. Not too familiar with it yet, but following is my first test map. I plan to follow up later with a full review of the mapping platform.
This maps shows US airports, with graduated symbols for volume of operations. It is interactive, with pan/zoom capabilities, location search, and dynamic info boxes. I'll be using this dataset in future map samples.
This maps shows US airports, with graduated symbols for volume of operations. It is interactive, with pan/zoom capabilities, location search, and dynamic info boxes. I'll be using this dataset in future map samples.
FiveThirtyEight: Our 33 Weirdest Charts From 2014
One of my favorite sites to take a look at during lunch, Nate Silver's 538 blog, has a rundown of some interesting infographics published during 2014.
FiveThirtyEight: Our 33 Weirdest Charts From 2014

FiveThirtyEight: Our 33 Weirdest Charts From 2014

Thursday, January 1, 2015
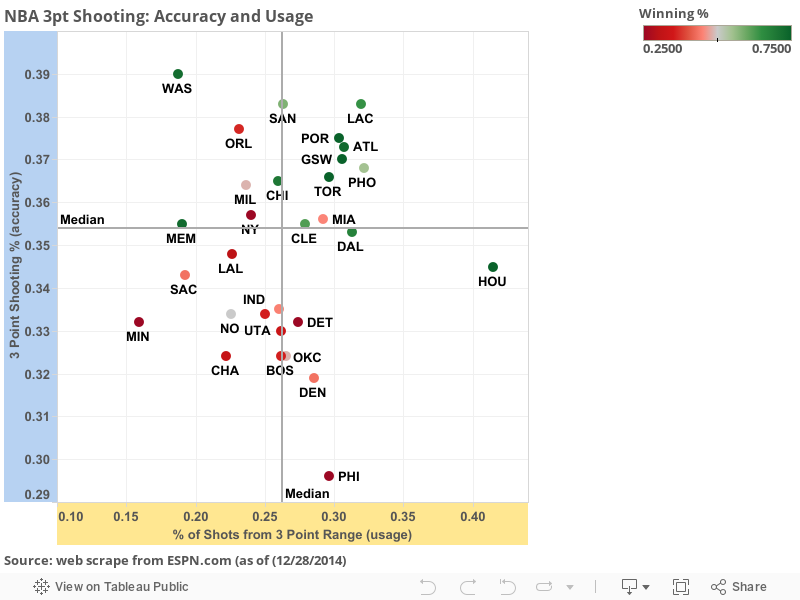
NBA 3 Pointers:
I've been watching the Boston Celtics some this season. This is a team in the mists of an extensive rebuilding plan, and sometimes the games can be brutal. I've been interested in watching the development of some of the young players and in trying to figure out coach Brad Stevens' offensive philosophy. It's been striking how many 3 pointers they shoot, and I often cringe as the shots go up. It got me wondering, is this just the way of the NBA these days, or do these Celtics shoot more 3 pointers that most teams? Also, is their accuracy significantly worse than a typical NBA team.
Naturally I decided to turn to the data.
Below is a scatter plot showing 3 point shot usage (% of shot attempts that come from 3 point range) and 3 point accuracy (% of 3 point attempts that are successful). The color indicates team winning percentage (red-low to green-high). The chart is interactive, click on a point to see the detailed data. The chart platform here is Tableau Public. A bit of a learning curve, but lots of fun once you get up to speed.
As it turns out, the Celtics shoot the 3 pointer an exactly typical amount of time, however their success rate is well below average. The chart also indicates how important the 3 point shot is to team success these days. Teams that can't do it well tend to be losers. I hope to update this dataset further into the season to see if the trends still hold true.
Subscribe to:
Posts (Atom)